Live visualization and data acquisition with LabJack
The easiest way to stream LabJack T-Series data into live plots on macOS and Windows. No code required.

LabJack makes some of the best low-cost data acquisition devices on the market. They’re reliable, have lots of different I/O, and can hit high enough sample rates and fidelity for most needs, without splurging on more expensive hardware.
Unfortunately, the software for working with LabJack devices is adequate at best. If you want an out-of-the-box way to collect data, you can use LJLogM and LJStreamM. These tools work, but they’re unintuitive, not very pretty, and Windows only. On a Mac, you’re out of luck if you want something that doesn’t require you to write code. LabJack’s own advice is to run them in a Windows virtual machine. You’re also pretty out of luck if you want to do no-code control.
We built Synnax Desktop to be one of the best free tools for working with any T-Series LabJack device. Fast, reliable, and intuitive data streaming and control are only a few clicks away. It runs on macOS and Windows, automatically finds your device, and gives you tons of flexibility for the experiments you want to run.
In this walkthrough, we’ll show you how to connect a LabJack T7, then acquire and visualize data from a thermocouple. Got a T4 or a T8? The steps are nearly the same, and we’ll call out the differences along the way.
What you need
- A LabJack T4, T7, or T8, connected over USB or Ethernet. The T7-Pro also works over Wi-Fi.
- A type K thermocouple. The T4 has no thermocouple support, so use any other analog sensor with it instead.
- A Mac with Apple silicon, or a Windows PC.
- Synnax Desktop.
The steps are the same on any T-Series device. The models differ in how they read thermocouples:
Step 1Wire up the thermocouple
On a T7, connect the yellow (positive) lead to AIN0 and the red (negative) lead to
GND:
Using a T8? Its inputs are differential, so connect yellow to AIN0+ and red to AIN0-
instead.
Step 2Install Synnax Desktop
- Install the LJM library from LabJack. Desktop uses it to talk to your device.
- Install Synnax Desktop and open it.
- Select New project, give it a name, and select Create.
Desktop runs the Synnax Driver, Synnax Core, and Synnax Console together on your computer:
Step 3Connect the LabJack
The Driver finds LabJack devices on its own by scanning through LJM: over USB every 5 seconds, and over Ethernet and Wi-Fi every 50 seconds. A networked device can take up to a minute to appear.
- Open the devices toolbar from the bar on the left.
- Select Connect device , then select LabJack hardware. The list
shows every LabJack that the scans found, each named after its model and the last
four digits of its serial number, like
LJM_dtT7-7383. - Select Configure next to your T7.
- Give it a Name, like
Lab T7, and an Identifier, liket7. The identifier goes in front of every channel on the device, so your thermocouple channel will bet7_AIN0. - Select Save and create read task.
Don’t see your device, or can’t connect to it? Over USB, only one program can open a LabJack at a time. Close Kipling and any other LabJack software, then wait for the next scan.
Step 4Read the thermocouple
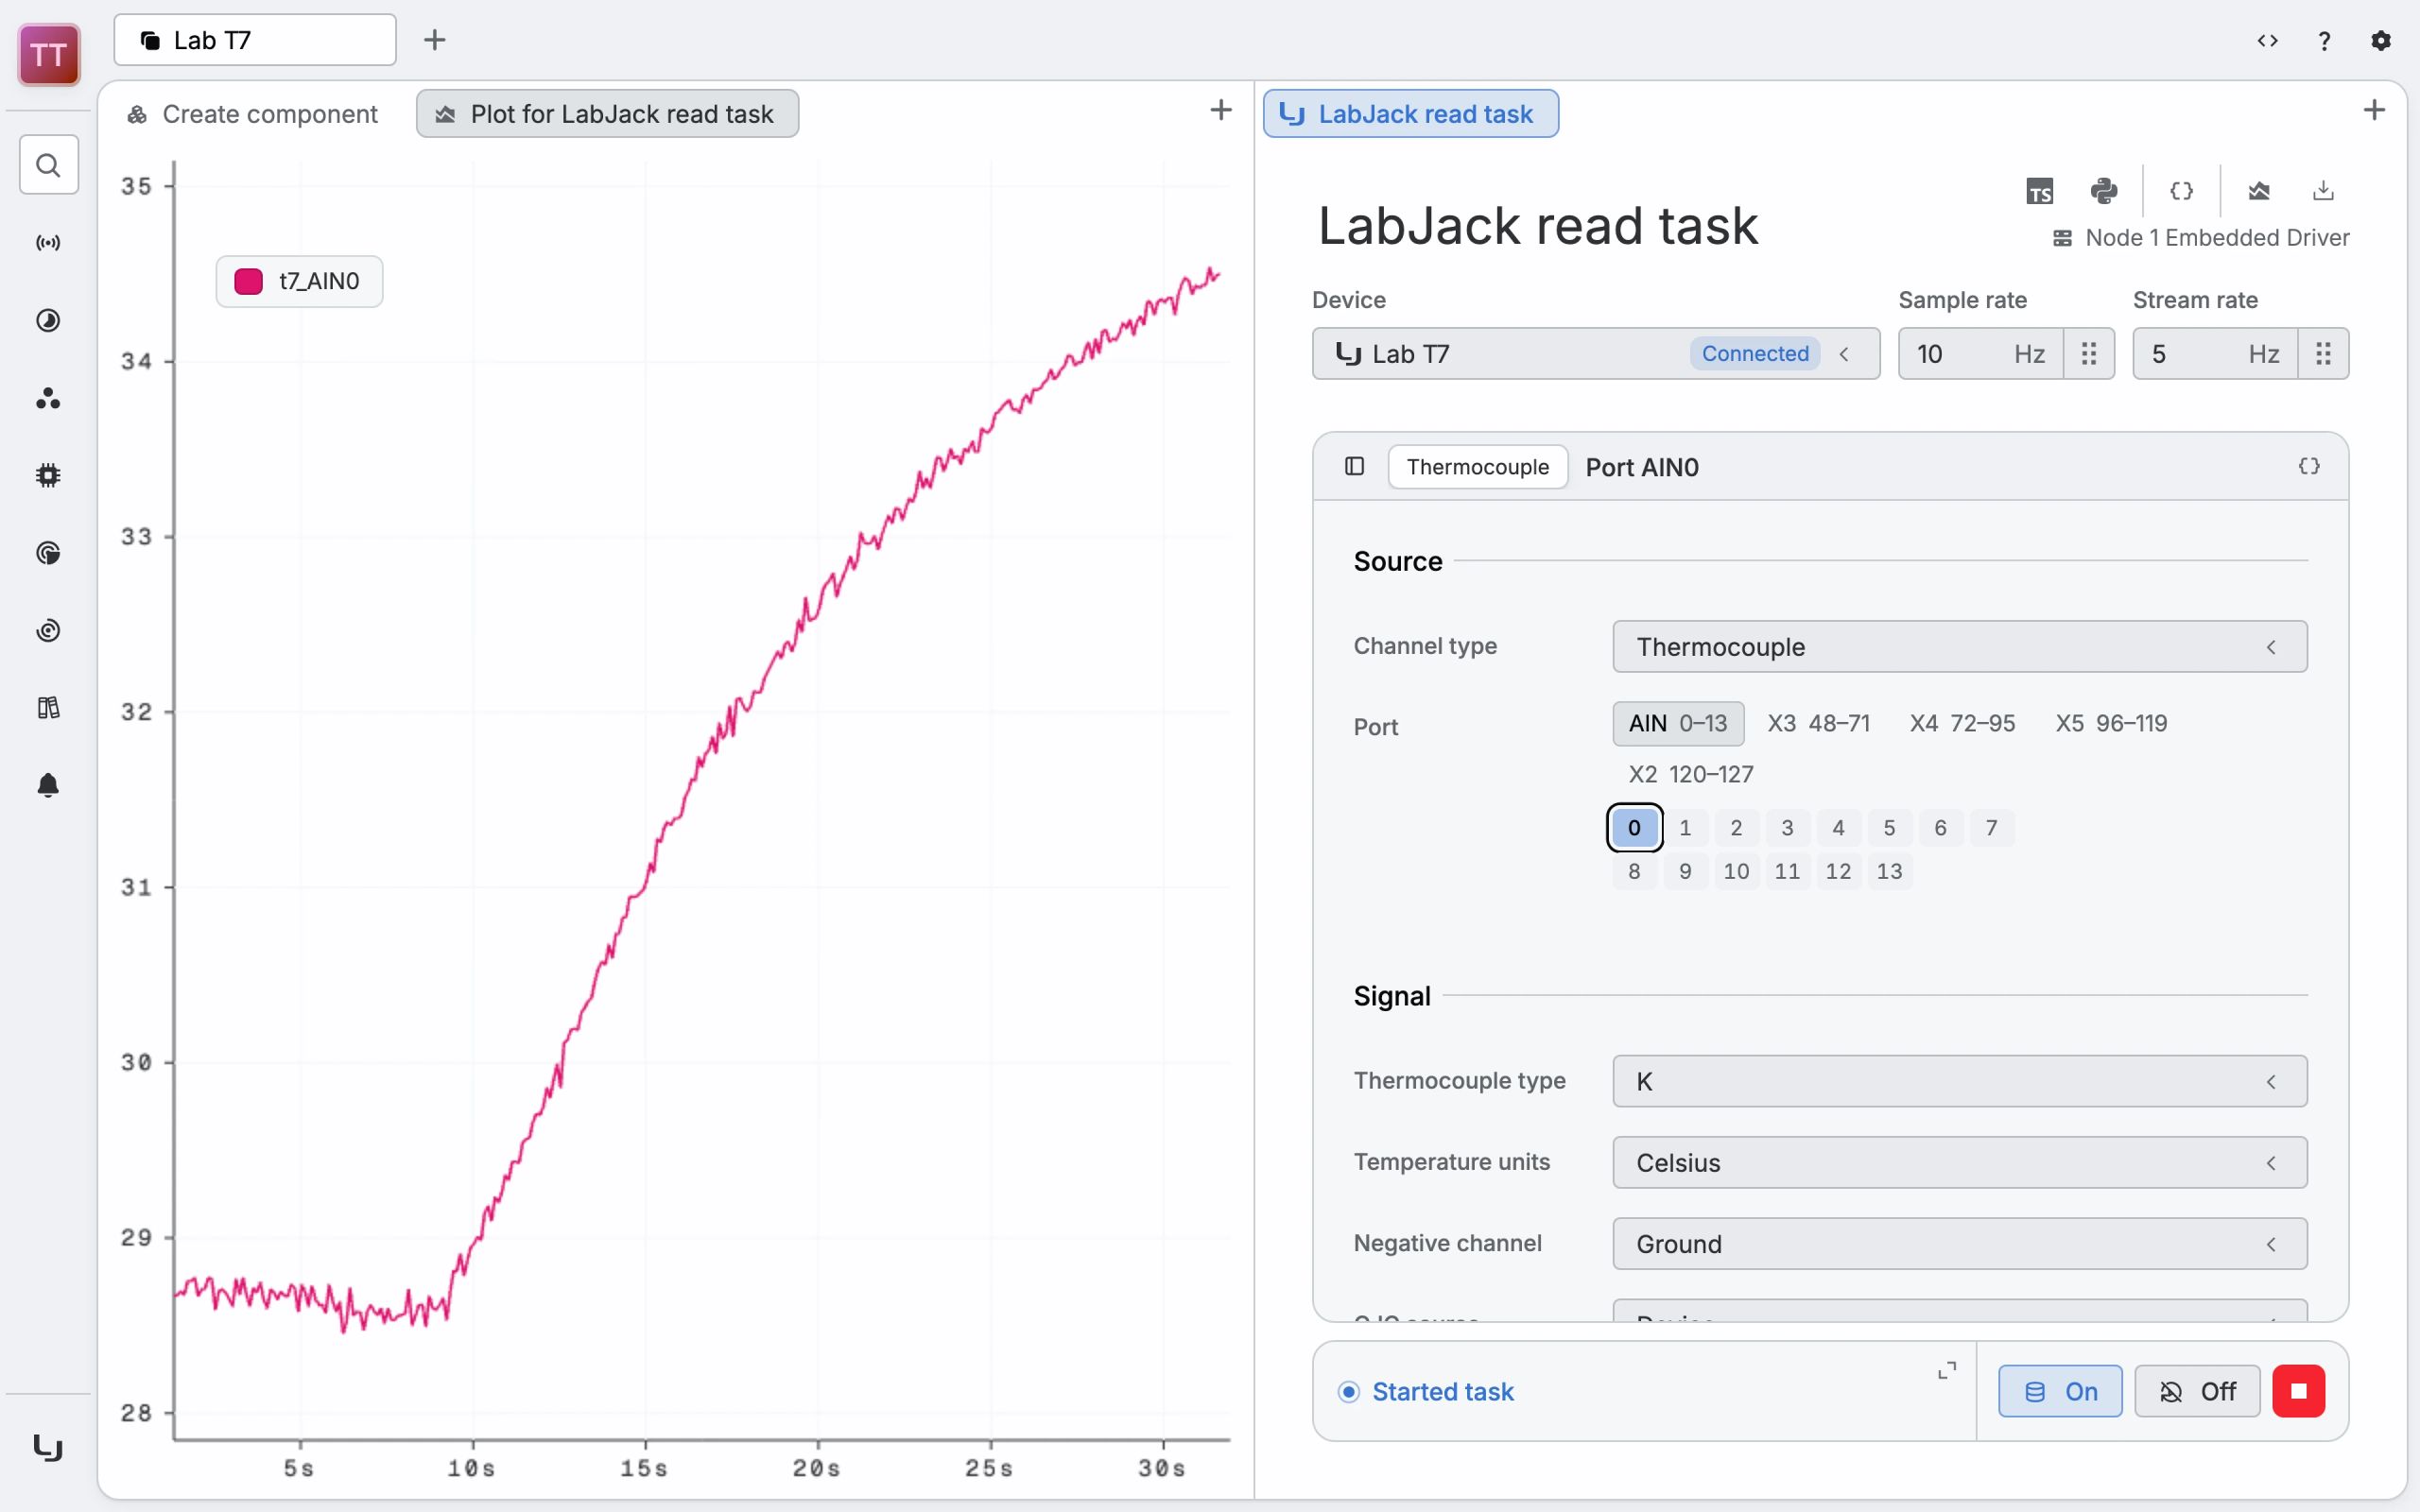
The new read task has one analog input channel, on AIN0. To read it as a thermocouple:
- Set Channel type to Thermocouple. The thermocouple type defaults to K, and cold-junction compensation defaults to the device’s internal temperature sensor.
- Set Temperature units to Celsius.
- Select the start button. The status changes to “Started task”, and the
task samples
AIN0at 10 Hz.
On a T4, skip the first two steps and leave the channel as Analog input. It reads volts instead of degrees.
Step 5Plot it live
- At the top right of the task, select Plot channels . A line plot
of
t7_AIN0opens, showing the last 30 seconds. - Hold the thermocouple’s junction, the welded tip, in your hand. The reading climbs several degrees within 30 seconds.
The task sends its samples to the Core at the 5 Hz stream rate, two per channel each time, so the plot updates five times a second.
Step 6Record and export
Data saving is on by default, so the Core stores every sample the task reads, and there’s no separate logging step. To export a span of it as a CSV:
- Hold Alt (Option on macOS) and drag across the plot to select a region.
- Right-click the selection and select Download region as CSV .
To find this test again later, select Create range from selection instead. A range is a named span of time, so you can search for it and plot its data again.
Next steps
From here, you can build on the same project:
- Schematics -> build operator screens with live values and buttons.
- Alarms -> get notified when a reading goes out of bounds.
- LabJack write tasks -> drive the LabJack’s analog outputs and digital output lines.
- LabJack read tasks -> every read task option, in detail.